Hierarchical Composite Outcomes: Win Ratio or Win Odds?
Part 3: Handling the "Ties" — Win Ratio vs. Win Odds
HEALTHCARERESEARCHEDUCATION
Martin Krsak
1/29/20261 min read
In hierarchical analyses, it’s common for a significant portion of patient pairs to result in a "tie" — meaning they had similar survival times, similar hospitalization rates, and similar biomarker changes.
How you handle these ties defines your metric:
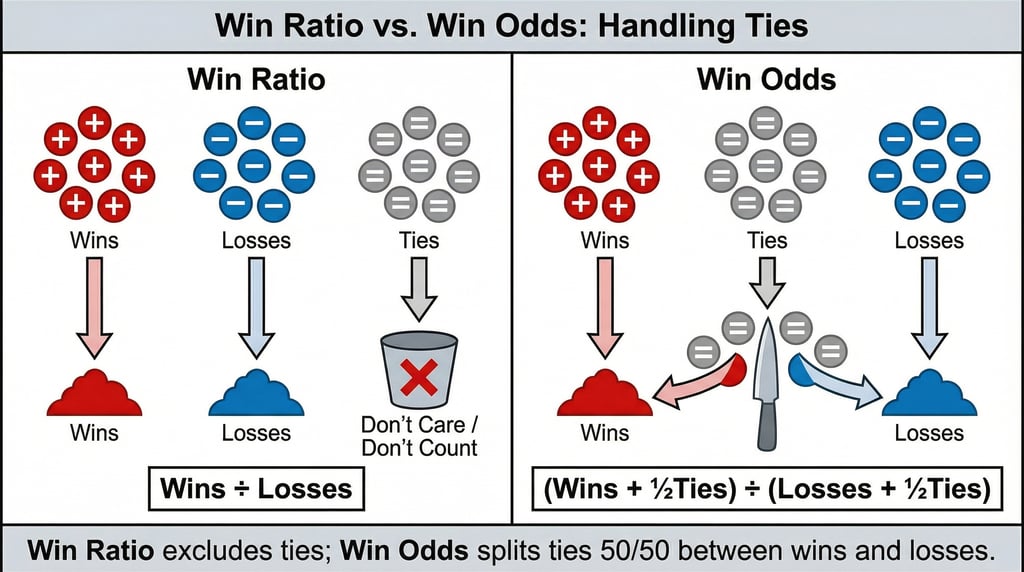
1. The Win Ratio: The "Decisive" Metric This method strictly ignores ties. It calculates the ratio of Wins to Losses only among the pairs where a clear difference existed.
The Effect: It provides a sharp measure of relative effect but discards data from patients who remained stable or similar.
2. The Win Odds: The "Inclusive" Metric This method accounts for everyone. It takes those tied pairs and assigns a "half-win" (0.5) to both the treatment and control groups.
The Effect: It often results in a smaller effect size because it dilutes the ratio with the "no difference" population, but it statistically represents the entire randomized cohort.
Visual: A split-screen illustration contrasting the treatment of tied pairs. The left panel demonstrates the Win Ratio approach, where 'tie' outcomes (grey circles) are discarded into a trash bin and excluded from the calculation. The right panel demonstrates the Win Odds approach, where the same tied outcomes are split by a knife, with half distributed to the 'Win' pile and half to the 'Loss' pile.
Consulting
Expertise in clinical & research management services:
+1-303-564-5110
© 2025. All rights reserved.